

Calculation of a forecast price for fish products
The fish market was analyzed on the example of humpback gutted HON and humpback round for the purpose of forecasting future market prices.
Initial date (source: fishnotice.com fish trade system):
|
Date |
Humpback salmon gutted HON |
Prices adjusted to 2015 |
|
August 2011 |
56,00 |
75,07 |
|
September 2011 |
67,67 |
90,71 |
|
October 2011 |
63,00 |
84,45 |
|
November 2011 |
62,50 |
83,78 |
|
December 2011 |
61,50 |
82,44 |
|
January 2012 |
62,00 |
83,11 |
|
February 2012 |
60,00 |
80,43 |
|
March 2012 |
60,00 |
80,43 |
|
April 2012 |
50,00 |
67,02 |
|
May 2012 |
48,75 |
65,35 |
|
June 2012 |
61,75 |
82,78 |
|
July 2012 |
73,50 |
98,53 |
|
August 2012 |
63,33 |
84,90 |
|
September 2012 |
61,33 |
82,22 |
|
October 2012 |
60,00 |
80,43 |
|
November 2012 |
54,50 |
73,06 |
|
December 2012 |
46,00 |
61,66 |
|
January 2013 |
48,67 |
65,24 |
|
February 2013 |
50,25 |
67,36 |
|
March 2013 |
44,00 |
58,98 |
|
April 2013 |
47,00 |
63,00 |
|
May 2013 |
50,00 |
67,02 |
|
June 2013 |
49,67 |
66,58 |
|
July 2013 |
65,00 |
87,13 |
|
August 2013 |
73,00 |
97,86 |
|
September 2013 |
67,75 |
90,82 |
|
October 2013 |
68,20 |
91,42 |
|
November 2013 |
69,25 |
92,83 |
|
December 2013 |
72,00 |
96,52 |
|
January 2014 |
80,67 |
108,13 |
|
February 2014 |
89,33 |
119,75 |
|
March 2014 |
105,00 |
140,75 |
|
April 2014 |
106,25 |
142,43 |
|
May 2014 |
103,63 |
138,91 |
|
June 2014 |
103,63 |
138,91 |
|
July 2014 |
97,00 |
130,03 |
|
August 2014 |
106,25 |
142,43 |
|
September 2014 |
122,00 |
163,54 |
|
October 2014 |
119,00 |
159,52 |
|
November 2014 |
129,00 |
172,92 |
|
December 2014 |
137,00 |
183,65 |
|
January 2015 |
146,67 |
146,67 |
|
February 2015 |
165,00 |
165,00 |
|
March 2015 |
172,50 |
172,50 |
|
April 2015 |
180,00 |
180,00 |
|
May 2015 |
130,00 |
130,00 |
|
June 2015 |
128,75 |
128,75 |
|
Date |
Humpback salmon round |
Prices adjusted to 2015 |
|
August 2011 |
56,40 |
75,60 |
|
September 2011 |
56,33 |
75,51 |
|
October 2011 |
57,33 |
76,86 |
|
November 2011 |
58,50 |
78,42 |
|
December 2011 |
49,50 |
66,35 |
|
January 2012 |
43,00 |
57,64 |
|
February 2012 |
47,50 |
63,67 |
|
March 2012 |
54,00 |
72,39 |
|
April 2012 |
46,33 |
62,11 |
|
May 2012 |
39,75 |
53,28 |
|
June 2012 |
70,25 |
94,17 |
|
July 2012 |
72,00 |
96,52 |
|
August 2012 |
61,33 |
82,22 |
|
September 2012 |
60,00 |
80,43 |
|
October 2012 |
61,00 |
81,77 |
|
November 2012 |
53,50 |
71,72 |
|
December 2012 |
43,25 |
57,98 |
|
January 2013 |
47,00 |
63,00 |
|
February 2013 |
45,00 |
60,32 |
|
March 2013 |
42,00 |
56,30 |
|
April 2013 |
44,00 |
58,98 |
|
May 2013 |
45,00 |
60,32 |
|
June 2013 |
61,32 |
82,20 |
|
July 2013 |
63,54 |
85,18 |
|
August 2013 |
64,50 |
86,46 |
|
September 2013 |
69,33 |
92,94 |
|
October 2013 |
69,80 |
93,57 |
|
November 2013 |
66,25 |
88,81 |
|
December 2013 |
73,33 |
98,30 |
|
January 2014 |
75,00 |
100,54 |
|
February 2014 |
87,00 |
116,62 |
|
March 2014 |
95,00 |
127,35 |
|
April 2014 |
112,50 |
150,81 |
|
May 2014 |
115,00 |
154,16 |
|
June 2014 |
109,00 |
146,11 |
|
July 2014 |
100,80 |
135,12 |
|
August 2014 |
102,50 |
137,40 |
|
September 2014 |
118,80 |
159,25 |
|
October 2014 |
119,50 |
160,19 |
|
November 2014 |
133,33 |
178,73 |
|
December 2014 |
129,06 |
173,01 |
|
January 2015 |
134,55 |
134,55 |
|
February 2015 |
140,21 |
140,21 |
|
March 2015 |
175,00 |
146,06 |
|
April 2015 |
160,00 |
152,09 |
|
May 2015 |
145,00 |
158,30 |
|
June 2015 |
135,00 |
164,69 |
The prices have been adjusted to the year 2015 with regard to inflation:
|
2014 |
11,36 |
|
2013 |
6,45 |
|
2012 |
6,58 |
|
2011 |
6,1 |
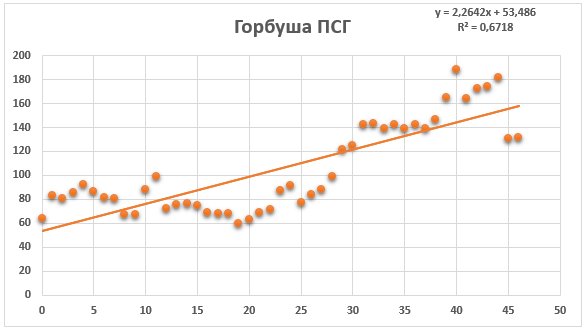
Pic. 1 – Initial prices for humpback gutted HON
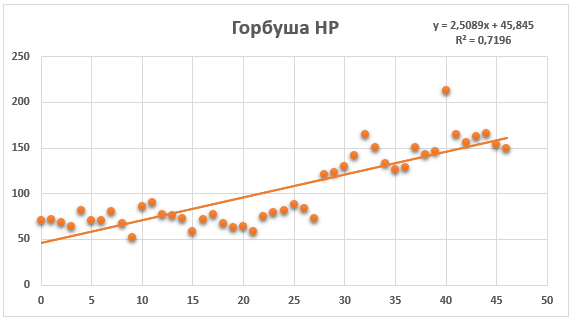
Pic. 2 – Initial prices for humpback round
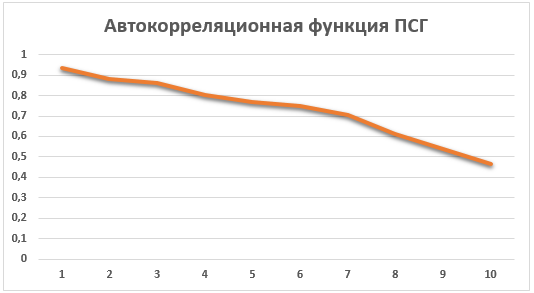
Pic. 3 – An auto-correlation function of gutted HON
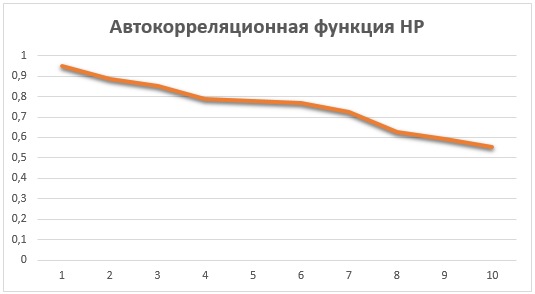
Pic. 4 – An auto-correlation function of round
High values of the auto-correlation function lagged below 4, which then decrease monotonously, indicate absence of any considerable seasonal element in the series and presence of a linear trend.
In order to identify the seasonal and trend components, seasonal decomposition of the series should be performed.
The initial sequence is flattened by 12 points for smoothing any runouts from the principal series.
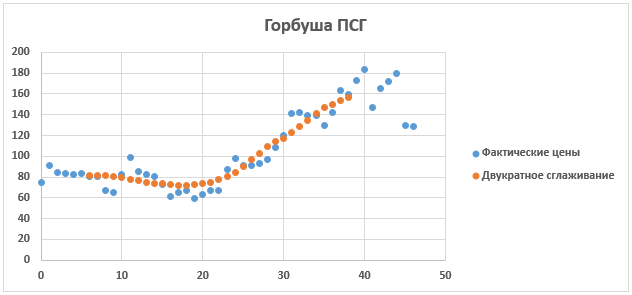
Pic. 5 – Smoothing Humpback salmon gutted HON
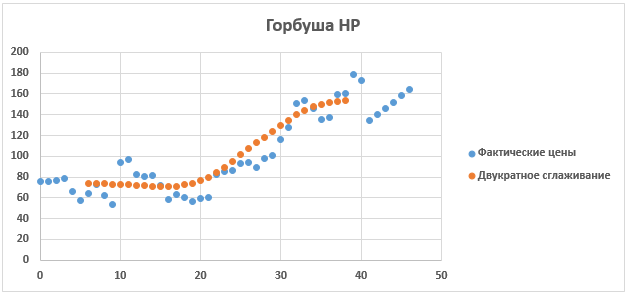
Pic. 6 – Smoothing Humpback salmon round
In the course of the decomposition the following seasonal coefficients were identified and normalized:
|
Humpback salmon gutted HON |
Humpback salmon round |
|
0,99170271 |
1,066236927 |
|
0,92608841 |
1,055964055 |
|
0,86759356 |
1,122567204 |
|
0,880241323 |
1,21970428 |
|
0,984197359 |
0,812307756 |
|
1,214058396 |
0,814931882 |
|
1,172200374 |
0,896990272 |
|
1,087323856 |
0,898371145 |
|
1,050082014 |
0,915215603 |
|
0,97642568 |
1,026318576 |
|
0,892040907 |
1,101047352 |
|
0,958045412 |
1,070344946 |
As a result, the seasonal component was excluded from actual prices. The trend if determined by the resulting prices.
Pic. 7 – Trend Humpback salmon gutted HON
Pic. 8 – Trend Humpback salmon round
The resulting price equations allow for forecasting prices 6 future months.
Forecast prices:
|
Date |
Humpback salmon gutted HON |
Humpback salmon round |
|
August 2015 |
158,57 |
133,02 |
|
September 2015 |
150,18 |
135,50 |
|
October 2015 |
142,66 |
151,39 |
|
November 2015 |
146,73 |
153,88 |
|
December 2015 |
166,29 |
159,06 |
|
January 2016 |
170,12 |
161,27 |